I measured Raspberry Pi power 36 times with different configurations of settings, running apps, and peripherals connected; I did all this to figure out how much power a Raspberry Pi is likely to use for your project.
A Raspberry Pi uses between 1.8W and 5.4W of power when measured at the USB power supply. The higher power draw occurs when the Raspberry Pi is performing intense CPU work and communicating using the WiFi. A minimal power draw can be achieved by turning off the WiFi, Bluetooth, and slowing down the CPU. If using the Raspberry Pi with a battery or UPS, additional power draw of approximately 0.5W should be considered as overhead for the AC-DC converter.
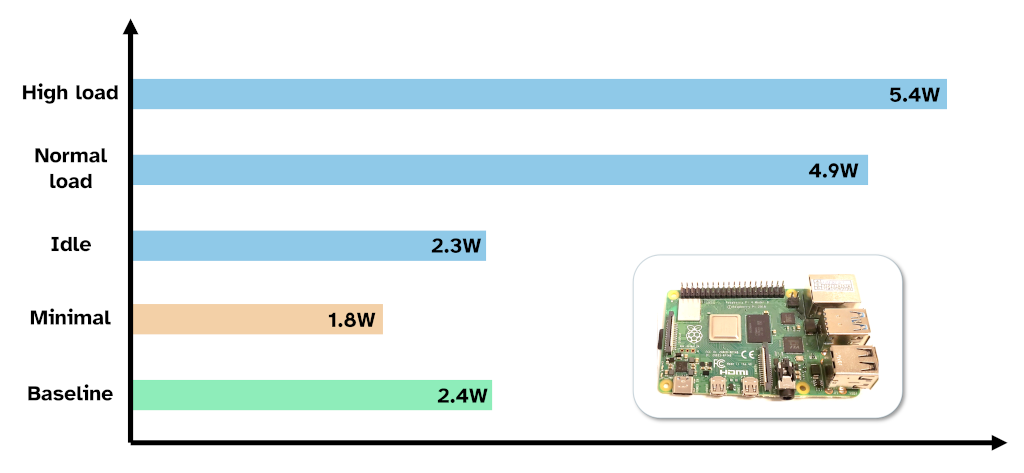
A summary graph of the Raspberry Pi power measurements I took in this experiment is below:
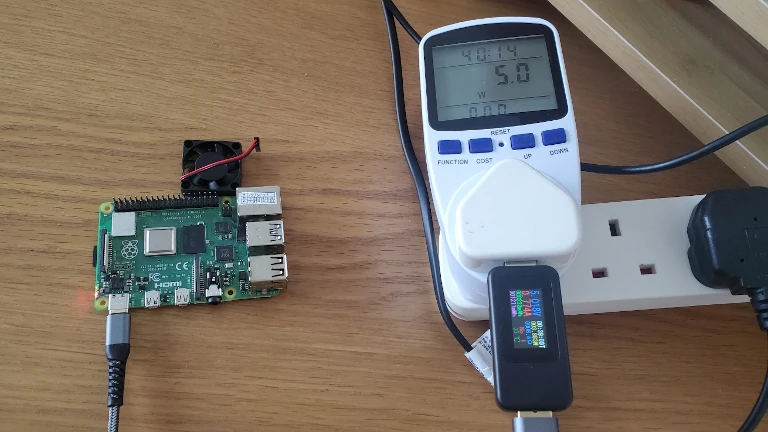
I also measured how much power is used for the Sense HAT (0.4W), to connect a Bluetooth keyboard (0.18W), and if a fan is used to cool the CPU (0.45W). All tests were done with my Raspberry Pi 4 running Raspberry Pi OS Bullseye 32bit, and measured using two different USB power meters, and a household appliance watt meter.
Full results and methodology (how I conducted the tests to get these numbers) are detailed below. In this guide I’ve also looked at:
- How much it costs to run a Raspberry Pi (roughly $1 to $3 per day);
- How long a Raspberry Pi can run on a battery (nearly an hour for a 1,000mAh battery); and
- How to make your Raspberry Pi use less power (e.g. by turning off WiFi).
Full Results: How much power a Raspberry Pi uses
The table below summarises the Raspberry Pi power readings from the experiment:
| Test | Reading (C Tester) | Reading (M Tester) | Reading (Watt meter) |
|---|---|---|---|
| Baseline | 2.4W | 2.3W | 2.7W |
| Minimal load | 1.8W | 1.7W | 2.3W |
| Idle load | 2.2W | 2.3W | 3.0W |
| Normal load | 4.7W | 4.9W | 5.5W |
| High load | 5.4W | 5.1W | 6.3W |
| No operating system | 2.4W | 2.3W | 2.7W |
Additional readings I took included:
- Adding a fan to cool the CPU, which added approximately 0.45W of power;
- Adding the Raspberry Pi Sense HAT, which added approximately 0.4W of power when in use;
- Adding a Bluetooth keyboard, which added approximately 0.18W of power;
I noticed the power draw spike as high as 7W in some rare occasions. This usually occurred during boot and with the fan connected. I never overclocked the Raspberry Pi as part of this experiment (though I did under-clock it for the minimal load test.
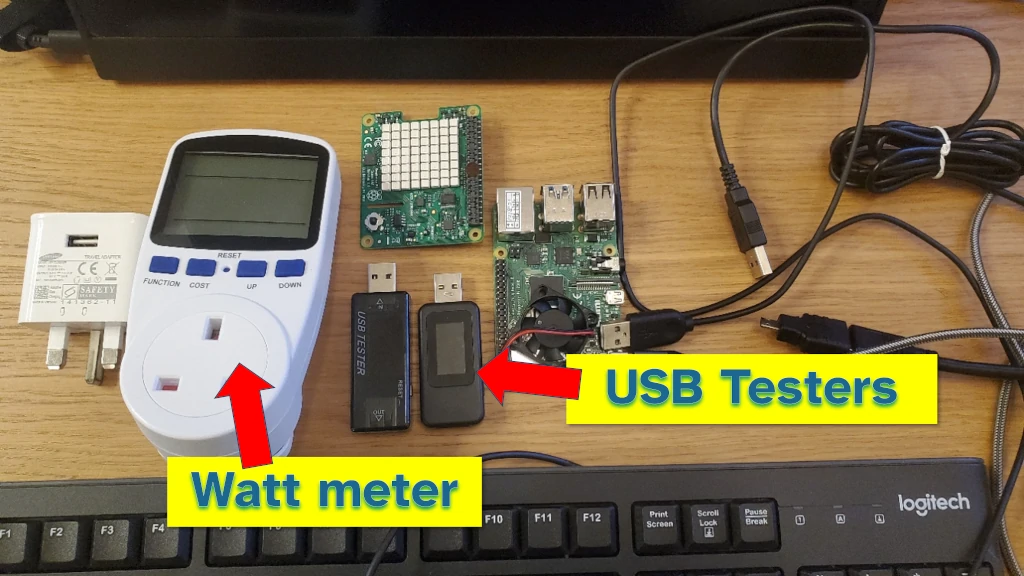
C Tester; M Tester; and Watt meter refer to the type of meter (USB meters and a home appliance watt meter respectively) that I used to conduct the experiment – as you can see each meter gave a slightly different reading which is why I used a few. Check out the methodology section below to see how I tested Raspberry Pi power usage.
The lowest reading I achieved was 1.7W of power. This was when the Raspberry Pi was configured to turn off WiFi and Bluetooth, turn off the ACT LED, and reduce the speed of the CPU – doing this represented a saving of about 600mW compared to the idle load tests. Further reduction could be achieved by turning off HDMI and USB (estimated savings around 150mW – 500mW, see References section for more details).
The highest reading I achieved was 5.4W of power. The Raspberry Pi had all necessary peripherals plugged in and was intensely calculating mathematical equations. I did notice a spike in power during boot up so it seems possible to force the Pi to draw more even without overclocking the CPU (this spike was around 7W but the fan was connected when I saw that).
Interestingly, the watt meter tended to show a greater reading than either of the USB meters. This is likely due to the watt meter measurements including losses in the AC-DC converter (the phone charger).
I also took current readings for the tests, these are summarised in the table below (useful if you’re estimating battery/UPS life):
| Test | Reading (C Tester) | Reading (M Tester) |
|---|---|---|
| Baseline | 0.47A | 0.41A |
| Minimal load | 0.36A | 0.34A |
| Idle load | 0.43A | 0.44A |
| Normal load | 0.95A | 0.95A |
| High load | 1.0A | 0.98A |
| No operating system | 0.47A | 0.45A |
The watt meter did not display a current reading.
As a sanity check, I looked at the sort of results others were getting from their benchmarking of Arduino power use. The References section of this guide has more detail, but it seemed by readings were in the right range when compared with the benchmarking of others (3.8W idle – 7.8W loaded).
Typical costs of powering a Raspberry Pi
Based on the measurements above it costs between $3.65 and $8.57 per year to run a Raspberry Pi. This is calculated from an electricity unit cost of 20 cents per kilowatt-hour. The cheapest running cost occurs when the WiFi and Bluetooth are disabled, while the most expensive occurs when the Raspberry PI is running intense calculations and communicating over the WiFi.
If you’re interested in more detail on the cost calculations, I wrote a separate guide to that here: chipwired.com/raspberry-pi-power-cost
I calculated this using the readings from the watt meter. The watt meter measurements include power lost to the AC-DC converter (I used a USB phone charger), and this lost power is reflected on your electricity bill at the end of the day.
If the Raspberry PI were powered by a 1000mAh battery, it would last just under 1 hour. If power saving measures were used, this could be extended to 2 hours. This estimate is based on the measurements above and a calculation given that batteries typically output a lower voltage (~4.3V) than the voltage available during the tests (~5V).
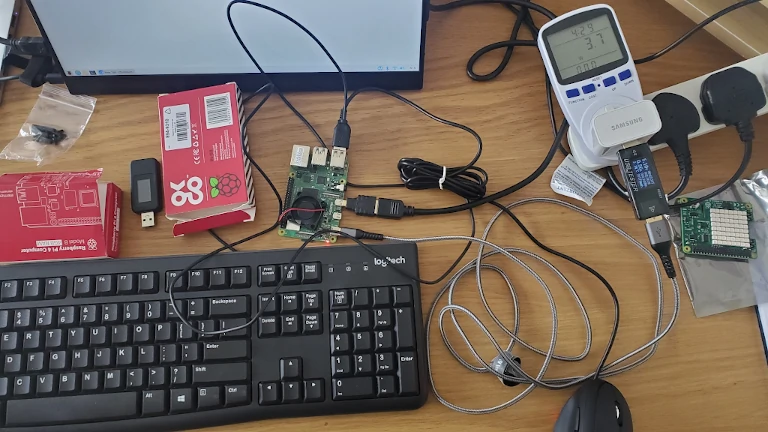
Methodology: How I tested Raspberry Pi Power Usage
To test Raspberry Pi power usage, I generally followed these steps:
- Connect the Raspberry Pi to one of the testing devices and the power source
- Run through each of the tests (often this included powering down the Raspberry Pi to change config.txt settings)
- Unplug the Raspberry Pi and connect it to the next testing device and repeat
I took measurements in the middle of each test, once the Raspberry Pi had settled a little. Often there would be a spike in power demand at the commencement of the test (e.g. when it first booted, or when it downloaded a large chunk of data for processing), and then it would settle into a steady-state of power draw. I tried to always take the average of this steady-state, as it did tend to fluctuate slightly.
My first power source was an Apple phone charger however I ran into a problem of the Raspberry Pi turning off, or even failing to boot, under certain configurations. This was because the phone charger was only really capable of supplying 5V and 1A (so 5W) of electricity. During some of my tests, the Raspberry Pi could easily draw 6W, and during boot I occasionally saw spikes of up to 7W of power draw.
The tests I ran aimed to represent typical use-cases for a Raspberry Pi, including pushing it to its limits of processing power. These are detailed in the table below:
| Test Name | Aim |
|---|---|
| Baseline | Headless operation with only WiFi running and no load on the CPU |
| Minimal load | Power saving operation by slowing down the CPU, turning off WiFi and Bluetooth, unplugging the HDMI and the mouse, and turning off the ACT light. |
| Idle load | To measure when the Raspberry Pi isn’t doing anything in particular: WiFi connected; HDMI connected; keyboard and mouse connected; Raspberry Pi OS running; no other apps running. |
| Normal load | To measure a normal use-case. Everything in idle, but I opened up a 1080p YouTube video in Chromium (and forced it to be 1080p). |
| High load | To push it to the limit. Everything in Idle, and I used a benchmark stress test to load the CPU with complex mathematical calculations to max out its power draw. |
| No operating system | No SD card (so no operating system), no HDMI, and no peripherals connected. To see what it’s like without an OS. |
| With Sense HAT | Idle test configuration with a Sense HAT added and the LED display in use. To measure the Sense HAT. |
| With bluetooth keyboard | Idle test configuration with a Bluetooth keyboard/mouse combo connected. To see if a Bluetooth connection had an impact. |
| With cooling fan | Various configurations (No OS, Normal load, High load) but with a fan attached to the 5V pin to cool the CPU. |
Raspberry Pi OS Bullseye 32bit was used for each of the tests conducted with an operating system (i.e. all except the no operating system test).
For the high load test I used the stress tool. I configured it to generate 8 CPU “workers” and run for 60 seconds; I tried to take the average reading over those 60 seconds. More detail about how to install and use the stress tool can be found here.
I was surprised the No operating system test drew more power than the Idle test (0.47W compared with 0.42W). This suggests to me that the operating system is able to instruct the CPU in such a way that it can reduce power when idle.
I think I could squeeze more power reduction out of the Raspberry Pi; I wasn’t particularly aggressive with the power saving options as I wanted the tests to reflect what I would use rather than what was possible. See below if you’re interested in more ways to save power.
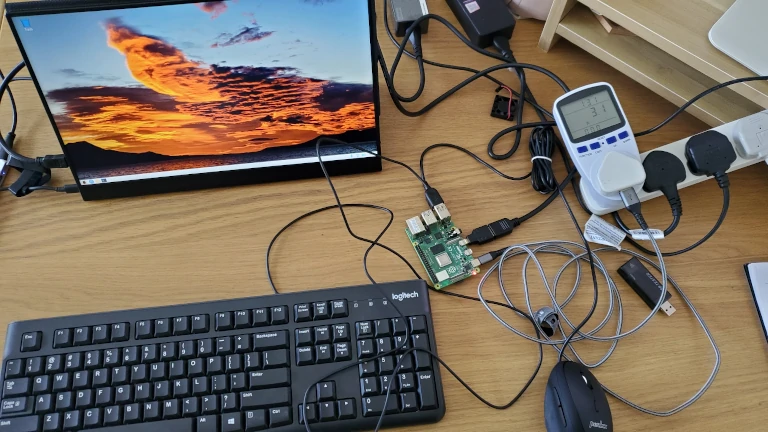
Similarly I never tried overclocking the CPU. This is where you can force the CPU to run faster than it was originally intended to with the side effects of consuming more power and generating more heat. Try this guide if you’re interested in overclocking, though I like to use a fan (see my pictures above) rather than the vertical stand.
How to use less power with a Raspberry Pi
When putting this experiment together I looked at different ways of minimising the power drawn by a Raspberry Pi, to see how suitable it would be to run as a remote data gathering tool or similar (a comparison to Arduino).
Some of the ways I found to minimise the amount of power a Raspberry Pi using include:
- Turning off the USB and Ethernet peripherals
- Throttling the CPU (slowing it down)
- Turning off WiFi and Bluetooth
- Turning off HDMI
- Turning off the ACT LED
- Choosing a different Raspberry Pi
I used a Raspberry Pi 4 in my experiment above, and it is a little more power hungry than the Raspberry Pi Zero or Pico boards. The Raspberry Pi forums discuss these options for power saving here.
Stopping apps may also reduce power by reducing CPU load. If you’re interested in various ways to stop apps running, check the guide I wrote here: chipwired.com/stop-program-raspberry-pi
I found it hard to think of useful reasons to implement all of these power minimisation features on a Raspberry Pi 4. Perhaps if you’re going to install the Raspberry Pi in a remote location with unreliable power and you only want it to collect data and save that data to an SD card for later retrieval. If this is the project you have in mind, consider a Zero, Pico, or an Arduino instead.
If your power source is unreliable, consider a UPS or battery back-up to run a Raspberry Pi. I looked at some of the options available (including costs) in my guide here: chipwired.com/can-raspberry-pi-connect-to-ups
Next steps
If you want to replicate this experiment, here are the tools I used:
The above are affiliate links and I may earn a commission if you purchase using them.
I’ve also written helpful guides on some of the uses of Raspberry Pi:
- How to collect data using a Raspberry Pi: chipwired.com/collect-data-with-raspberry-pi
- Databases that run on a Raspberry Pi: chipwired.com/databases-for-raspberry-pi
- How to analyze data on the Pi itself: chipwired.com/analyze-data-raspberry-pi
References
I used a few references as I was conducting this experiment and writing this guide to make sure I was on the right track. The detail of these is below:
- For more information on how to reduce Raspberry Pi power use, in particular by disabling HDMI and USB, reference is available here.
- For the sanity check comparison I used for Raspberry Pi power use, there’s a fairly comprehensive benchmark of Raspberry Pi available here.
- If you’re interested in the difference between watts and amps, check out the guide here.
Chris used to conduct experiments like this in a university laboratory, it’s good to see these skills haven’t gone to waste!