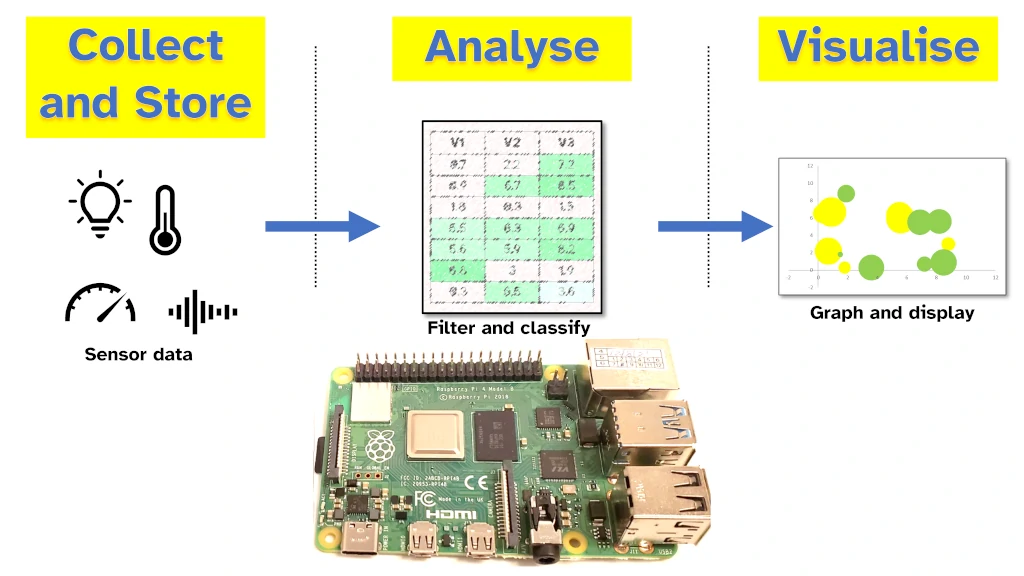
Raspberry Pi is a great tool for analyzing data. A single Raspberry Pi can participate in all stages of a data analysis process: It can collect and store data from sensors or the internet; it can analyze that data with filters, mapping, and correlation; and it can visualize the data on dashboards, graphs, or by sending it to a third party tool.
A complete process of analyzing data on Raspberry Pi follows these 4 steps:
- Deciding what to measure and finding sensors to collect data
- Reading sensors and storing the data
- Analyzing data by applying filters, and correlating
- Visualizing the data on a graph or dashboard
This guide covers collecting data, storing data, analyzing data with filters and correlation, and displaying data for an audience. I work extensively with data and it’s exciting to see that something as small as a Raspberry Pi can handle an entire data analysis process.
I believe Raspberry Pi has immense power to capture and analyze data, even when there are more powerful computers available. Hopefully by the end of this guide you’ll have an idea of the best ways to analyze data with a Raspberry Pi.
Step 1: Decide the data to collect and find sensors to measure it
Data analysis typically starts with figuring out what decisions we want to make: Do we want our autonomous car to accelerate or brake; should we bring an umbrella; should we open the door (because someone is there), etc. To decide which data to collect, and how to collect it, we need to understand the objective of our project.
What decision is our Raspberry Pi going to help us make? Understanding what decisions we want to make helps us define the variables that we want to collect. These variables tell us the sensors that we need to use.
| Decision | Variables / Sensors |
|---|---|
| Should we bring an umbrella? | Temperature, humidity |
| Should we turn left or right? | Visual sensor, obstacle detection |
| Is someone behind me? | Light sensor |
| Should we turn this tap on? | Water flow sensor |
Some examples of variables that are good to record with the Raspberry Pi (using sensors):
- Temperature
- Humidity
- Presence of something (e.g. to count something)
- Light
- Movement
- Sound
- Time
I’ve found these sensors to work well with a Raspberry Pi. There are other sensors that can be connected to a Raspberry Pi (gas, electric current, air flow, and more!) though I’ve found them a little harder to work with, particularly if using a Raspberry Pi 3 or 4 (when something goes wrong with the I2C interface, it’s a pain to fix!).
Typical data anlaysis in my experience is the filtering and then comparison of these variables. Using a Raspberry Pi with sensors connected, we gather data on these variables to put in the data analysis process.
Sensors connect to the GPIO. They can be connected directly to the GPIO, or they can be connected using I2C, SPI, or another communications protocol that the GPIO supports.
To connect a sensor to a Raspberry Pi:
- Identify how the sensor wants to be connected to the Raspberry Pi (typically SPI, I2C, or directly to a GPIO pin)
- Connect the sensor to the correct pin
- Read the sensor using Python or a similar programming language (see Step 2 below)
To know which pin is correct for your sensor, check out the pin-out diagram for the Raspberry Pi here. These are the instructions I first followed when figuring out how to read sensor data into the Raspberry Pi.
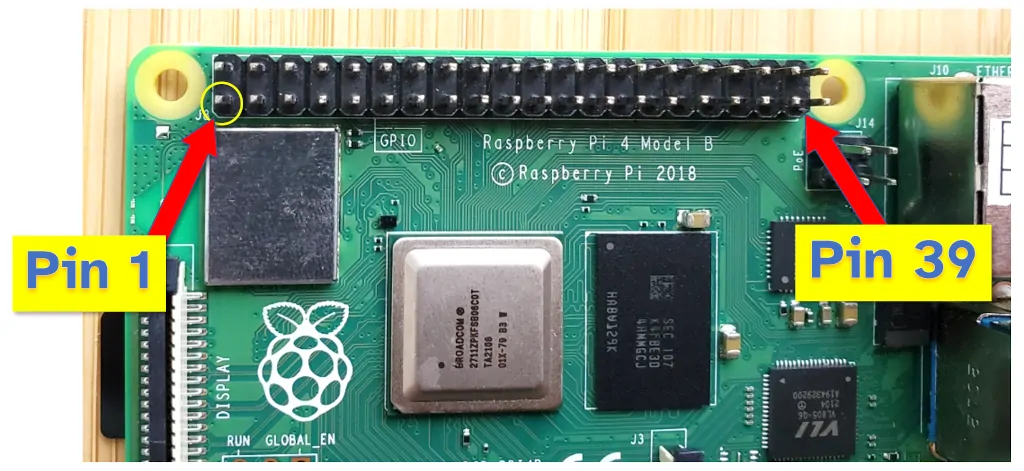
It’s possible to connect multiple sensors to a Raspberry Pi. The GPIO has at least 16 pins to which sensors can be connected directly. It also supports UART, SPI, and I2C – these are communications protocols which allow many more sensors to be connected and communicate with the Raspberry Pi.
A Raspberry Pi can also collect data from other sources, such as the internet. If you’re interested in collecting data from the internet, or other alternative data sources (such as Arduino), check out my guide here: chipwired.com/collect-data-with-raspberry-pi/
Step 2: Read the sensors and save the data
After connecting the sensors to the Raspberry Pi, the next step is to take readings from the sensors and store the data. To take readings from sensors:
- Import the
gpiozerolibrary for Python - Read from the connected sensor (directly, or by using SPI or I2C)
- Store the data (see below)
Data read from sensors must be stored somewhere. The table below compares the options for storing data with a Raspberry Pi:
| Storage | Pros | Cons |
|---|---|---|
| In memory (variables, dictionaries) | Up to 200 – 300mb of data (approx.) Quick access | Data lost if power is lost Difficult to share with other computers |
| Flat file (CSV or Excel) | Up to 200 – 300mb of data (approx.) Data preserved if power is lost (if handled properly) Can share with other computers | Difficult to manage complex data (if your data doesn’t fit in a table) Your code needs to manage the file so that data is saved if power is lost |
| Database (SQL, JSON) | Can store >100GB of data (depends more on the size of your SD card or cloud storage) Data preserved if power is lost Easy to share with other computers Easy to update and add to the data | Complex to setup Complex to read and write from your app |
In memory is typically when you declare variables or dictionaries in your programming language and store the data there; flat files are CSV, Excel, or similar files that are easy to open with other apps; and databases are typically larger data stores that you have to connect to (even if the database runs on your Raspberry Pi).
I’ve found:
- In memory storage is best for controlling other devices and for dashboards – the data will be used quickly and then likely doesn’t need to be saved
- Flat file storage is best for sharing a file with another computer, such as when you want to do the analysis on a desktop
- Database storage is best for online backups and cloud storage
Step 3: Analyze the data by filtering and correlating
Once data is available – either collected in real time or available from storage – the Raspberry Pi can properly analyse that data.
Typical data analysis tasks that can be undertaken on a Raspberry Pi include:
- Filtering of data – do we want to see data over a certain time period; do we want to remove outliers?
- Categorisation – Grouping the data into categories (though typically with a Raspberry Pi analytics process, we take care of this in Step 1 as our sensors help define our categories)
- Correlation – comparing 2-3 of the categories to see if there is any relationship between them.
The table below lists a summary of data analysis tools I’ve found helpful on Raspberry Pi:
| Analysis Tool | Pros | Cons |
|---|---|---|
| Pandas (Python) | Lots of documentation available Supports working with a variety of data Fast when operating on a lot of data | Requires coding to use |
| Excel | No code needed Quick to see the results of simple analysis tasks | Doesn’t run on Raspberry Pi (need to export data from the Pi to another computer) Not free |
| Ruby | Has a great dashboard system available (see Step 4: Visualization below) | Requires coding to use Not as well documented as Pandas |
I’ve found Pandas to be the best library to use for these tasks on Raspberry Pi. It’s a very popular Python library that quickly helps you filter, correlate, and display data. Other languages and tools are available (such as SQLite), but these can be a little more complicated to use. If you’re interested in alternatives to the above, check out my guide to data analysis tools for Raspberry Pi here: chipwired.com/raspberry-pi-data-analysis-tools/
To use Pandas on Raspberry Pi:
- Ensure it’s installed by opening the Terminal and running the command:
sudo apt install python3-pandas - Import Pandas into your Python code by using a command such as:
import pandas as pd - Read your saved data, Pandas supports CSV, Excel files, in memory storage (data frames), and more
Pandas can then be used to analyse your data. A good example I found of how to use Pandas is here. The use of Pandas Profiling is a great way to quickly understand what your data is like.
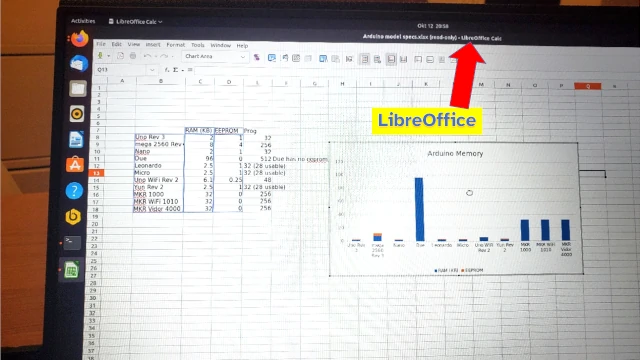
Excel can also be a good choice. To use Excel for data analysis with a Raspberry Pi:
- Save the data as a CSV or .xlsx file using Python
- Transfer the file to another computer, such as via cloud storage or email
- Open the file in Excel to analyse the data
I prefer to use Excel for simple analysis tasks on small amounts of data where decisions don’t have to be made instantly. For example, if I’m writing a report on some data for a client and I have 3 weeks to write the report, I’ll probably do the analysis in Excel. If I’m creating a data stream for a dashboard that’s going to be updated every 5 minutes, then I’ll use Python (and typically Pandas).
For more details on how to work with Excel files on Raspberry Pi, check out my guide here: chipwired.com/r-pi-open-excel-files/.
In some data projects I’ve stopped here. A table of data in Python or Excel can be sufficient analysis to solve simple problems (e.g. finding average temperature per day). It can also be sufficient if you’re building a device that automatically makes instant decisions based on your analysis (e.g. when the temperature reaches a certain point, raise an alarm). A display of this data can still make a project look more impressive however 😉
Step 4: Visualize the data using graphs or a dashboard
Visualising the data is the last step in our analysis process. We display the data to help tell a story and make decisions based on the data we collected. Whenever humans are making the decisions, I like to use graphs or a dashboard to display our analysis.
The best ways I’ve found to visualise data with Raspberry Pi are:
- Graphs drawn using Python, R, or similar programming languages
- Connecting it to a third-party service such as Tableau
- Building a dashboard run from the Raspberry Pi itself
Graphs are best for printed reports where data doesn’t have to be read for a while (where you can allow days for decisions to be made); connecting to a third-party service such as Tableau is great when you need to share the visualisation with others; and building a dashboard is perfect when you want to show off the data in a physical setting (think displaying the data on a TV in a room).
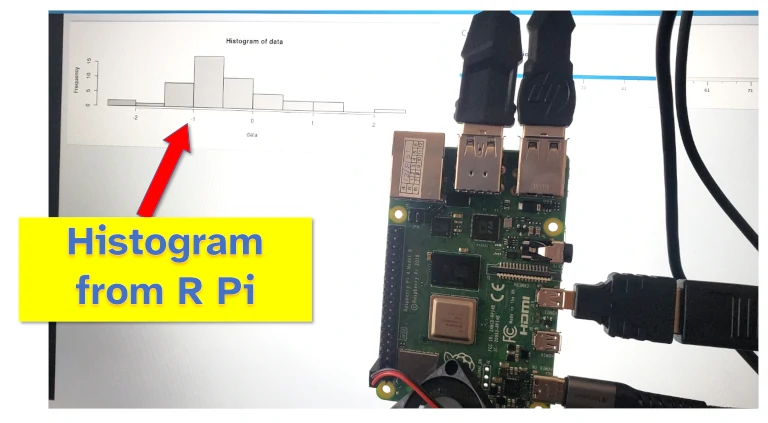
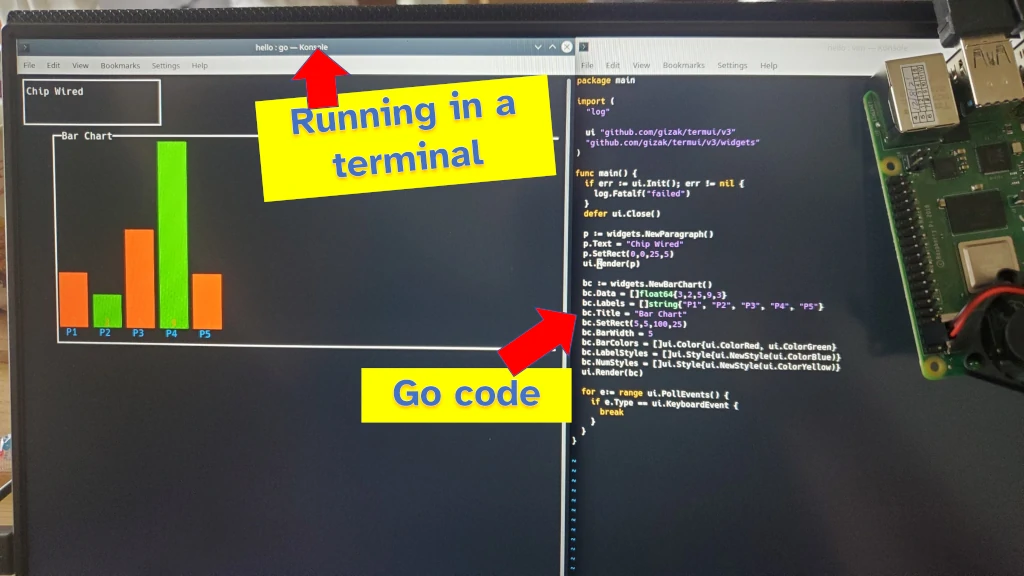
To make a graph using a Raspberry Pi:
- Install the graphing library for your preferred programming language
- Prepare the data in the specified format
- Run the code to produce a graph
I like to use PyPlot for Python or Gadfly for Julia (yes Julia runs on Raspberry Pi). I also like using Excel to make plots and graphs (i.e. save the Raspberry Pi data as CSV or .xlsx file, then do the graphing on a desktop computer).
I’ve found building a dashboard or connecting Raspberry Pi to a third party service to be better ways to analyse its data rather than drawing a graph. In my experience, I’ve typically used graphs in printed reports or slide show presentations; while these things can be produced with a Raspberry Pi, there are better tools for the job.
To connect a Raspberry Pi to a third party service:
- Import the API library for the third party service (if they don’t have one, try the Python Requests module)
- Open a connection to the API
- Upload data to the API
Typically a third-party API will come with instructions on how to connect to it to upload data, even if it doesn’t have its own library or module. An example of Tableau’s is here.
Alternatives to Tableau include Power BI (by Microsoft), Qliksense, and Datapine.
I typically avoid using a third-party service as these cost money. I have seen projects though where it’s worth spending the extra money on a third-party service – these are typically where the project is in a professional work-place setting.
My favourite way to use a Raspberry Pi for data visualisation is using it to display a dashboard:
To build a dashboard using a Raspberry Pi:
- Install a programming language and its dashboard package on Raspberry Pi
- Configure the dashboard to show the variables and data
- Import data
- Display dashboard
A dashboard is great for showing data that is frequently updated, as it gives a ‘real time’ view of data. I’ve also used it though to display data that never changes – I’ve found people really enjoy looking at data visualisations on a dashboard.
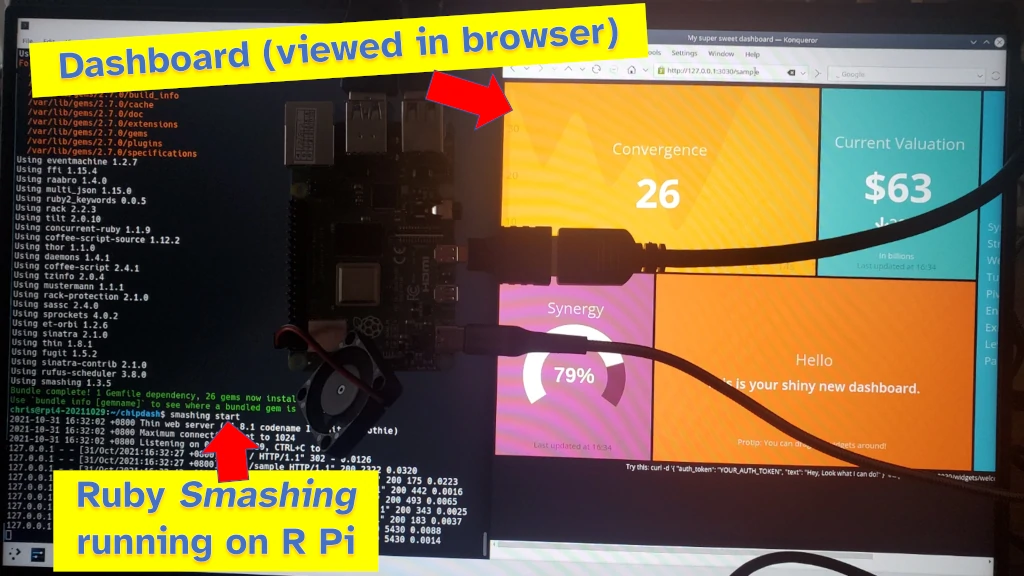
The best dashboard tool I found for Raspberry Pi was Smashing, a library for the programming language Ruby. I found it easy to install and configure, and to connect collected data to. The only downside was that I couldn’t read directly from the Raspberry Pi’s sensors using Ruby – I had to import the data using Python, then read the data into my dashboard using Ruby.
I wrote a dedicated guide on how to build a dashboard using a Raspberry Pi (including a how to use a variety of tools to display the data). Check it out here: chipwired.com/raspberry-pi-dashboards/
Chris believes many parts of modern data analysis is too complicated to make it accessible to people who can benefit from it. By using simple analytics tools, such as those available on Raspberry Pi, he is hoping to show people that data can be accessible to anyone. Chris also originally learnt to spell analyse with an ‘s’.