I believe Raspberry Pi can be a useful tool for data analytics. It can collect, store, and display data; it can also be used as a tool to analyse it. In this guide I’ve listed ways to analyse data within the capabilities of the Raspberry Pi’s hardware and software.
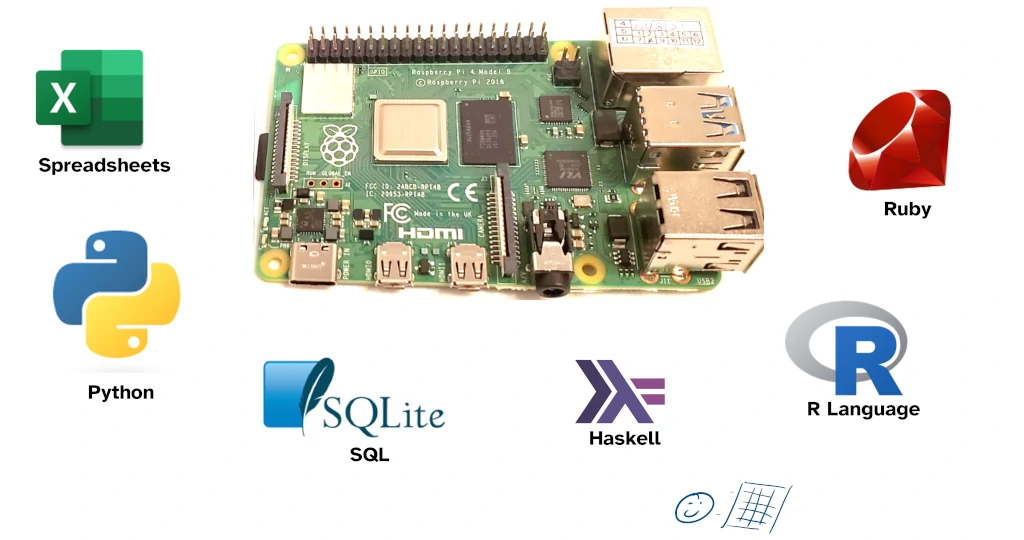
Data can be analysed with a Raspberry Pi using spreadsheets, programming languages, or graphical analysis tools. Tools that can be used for data analysis include spreadsheets, Python, Julia, R, SQL, and OCaml. While many of these tools will work with the Raspberry Pi OS, a 64-bit operating, such as Debian, has more compatible tools available.
This guide to data analysis tools on Rasbperry Pi includes:
- Software that you can use to visually analyse data (such as spreadsheets)
- Databases and data storage tools (i.e. the cloud) that can analyse data
- Programming languages you can use for analysing data
1. Spreadsheets
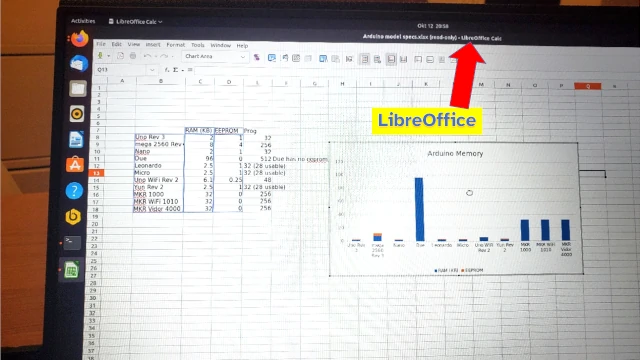
Raspberry Pi can analyse data using spreadsheets. Spreadsheets are a graphical tool for representing data, allowing that data to be inspected, analysed, summarised, and presented visually. Excel files are typically the example of spreadsheets that come to mind when thinking of how to use them to analyse data.
Using spreadsheets to analyse data on a Raspberry Pi is good for:
- Simple or small amounts of data
- Building quick displays and graphs
- Filtering the data for inspection
- Reading the data before analysing it further in another tool
Spreadsheet apps that run on Raspberry Pi include:
- Microsoft Excel 365
- Google Sheets
- LibreOffice Calc
Only the web version of Excel will work with the Raspberry Pi. Programming languages (such as Python) can also open spreadsheet data and manipulate it. If you want to analyse data using spreadsheets, I recently wrote a guide on how to open and manipulate spreadsheets using a Raspberry Pi, check it out here: chipwired.com/r-pi-open-excel-files/
2. SQLite
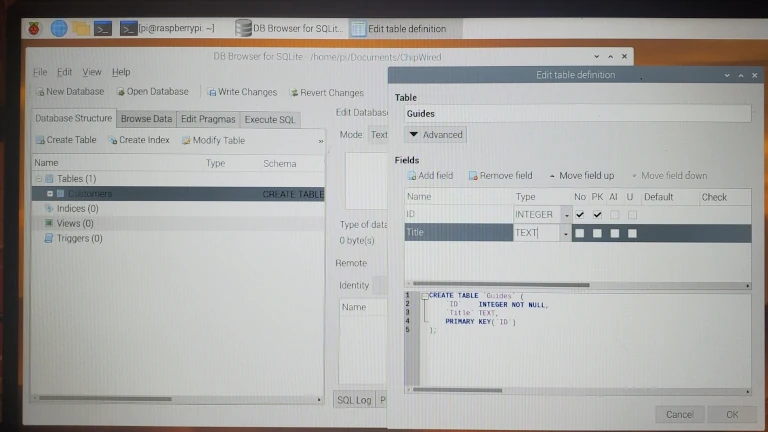
SQLite is a database tool that can run on Raspberry Pi. Data stored in an SQLite database can be read and analysed using SQL. Graphical tools to help with this analysis also run on Raspberry Pi.
Consider using SQLite to analyse data on a Raspberry Pi when:
- Reliable data store is important – if your analysis relies on the reliable storage of data in a database
- Data fits the table structure (columns and rows) used by SQLite
- Analysis tasks can be expressed as database queries
I’ve found SQLite to be a great data analysis tool when used in conjunction with the data analysis programming languages I’ve described below. It’s also a more sophisticated alternative to spreadsheets – you get a lot more freedom and power when summarising and joining tables of data.
To install SQLite on a Raspberry Pi:
- Open a Terminal and use this command: sudo apt update && sudo apt install sqlite3
- Install the database browser to go with it: sudo apt install sqlitebrowser
- Connect to SQLite, create tables, and start adding and querying data for analysis
I wrote more detail on these steps in my guide to SQL for Raspberry Pi, check it out here: chipwired.com/sql-databases-for-raspberry-pi/. Many of the programming languages included in this guide work great with SQLite, I included some details in that guide of how to get started with popular programming languages.
3. Haskell
Haskell is a functional programming language that can easily work on large sets of data. Raspberry Pi supports the full Haskell installation, including compiler and interactive interpreter.
Using Haskell on Raspberry Pi is good if you want to process data using complicated mathematical formula that you’ve defined. It can also be good to develop modules of code to re-use in analysis on different data sets.
To install Haskell on Raspberry Pi:
- Open the Terminal and type in this command:
sudo apt update && sudo apt install haskell-platform - Run the Haskell interpreter using the following command:
ghci - Write code to import and analyse your data
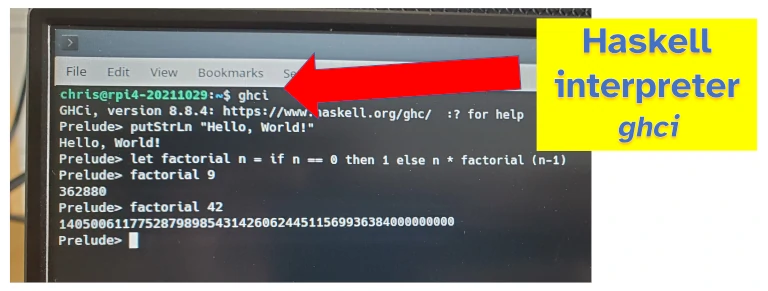
I was intrigued by the introduction to Haskell page (found here) as it stated the first program someone writes in Haskell isn’t “hello world”, but is instead “Factorial”. It’s been a while since I wrote a real program in Haskell and it takes some getting used to again (it’s easier if you have a mathematical background).
Need data to analyse? Check out the guide I wrote on how to collect data with Raspberry Pi here: chipwired.com/collect-data-with-raspberry-pi/
4. Python
Python is one of the most popular data analytics programming languages in the world. It’s also often the first programming language available on a new Raspberry Pi.
Python has an extensive range of data analysis libraries, all of which (at least as far as I’ve tried) run on Raspberry Pi. Some of the data analysis libraries that run on Raspberry Pi include:
- NumPy
- Pandas
- Matplotlib
I’ve found there are some limitations to what the Raspberry Pi can do though – its processor is not as powerful as larger computers, and therefore it might struggle a little with significant data operations or when manipulating large datasets (multiple gigabytes).
Using Python to analyse data on a Raspberry Pi is good for:
- Building data dashboards that display metrics the Raspberry Pi is monitoring
- Calculating metrics from data that the Raspberry Pi has collected
- Providing a “first pass” analysis on collected data before sending it off to another service for deeper analysis
This makes the Raspberry Pi great for briefly analysing data sets that the Pi has collected and even displaying some insight into that data. A Pi can also use its WiFi or Ethernet connection to send that data off to another service for deeper analysis.
To start using Python for data analysis:
- Ensure Python is installed on your Raspberry Pi by opening up the terminal and typing in the command:
python3 - If not installed, use this command to install Python:
- Write a Python script to read some data and analyse it
- Run the script using the Terminal and the
python3command
I found this example of how to analyse data with Python to be really good at explaining the steps involved in putting together a Python script for analysis.
Jupyter also works on a Raspberry Pi – giving you a notebook tool to help visualise and document the steps you’re using in your analysis. Jupyter needs to be installed before use, check out the guide here if you’re interested.
5. R
The R programming language is synonymous with statistics and data processing – it well supports common and intricate data analysis tasks, and provides tools to quickly visualise and work with data. A Raspberry Pi can run code and scripts written in R.
Using R with Raspberry Pi can be good if:
- You already have a strong background in statistics
- Advanced statistical operations are required
- Quick and easy charts are to be drawn
I’ve found R great for statistics and making quick plots of data for analysis. My friend swears by R for most of his analysis of customer data, though whenever I have a data analysis task I typically reach for Python.
I also feel there are better alternatives if you want to build data dashboards – I wrote a whole guide on data dashboards which presents some better alternatives (like Ruby), check it out here: chipwired.com/raspberry-pi-dashboards/
To install R on a Raspberry Pi, open a Terminal and type this command: sudo apt update && sudo apt install r-base r-base-dev
Then run the interpreter using the command: r
6. Ruby
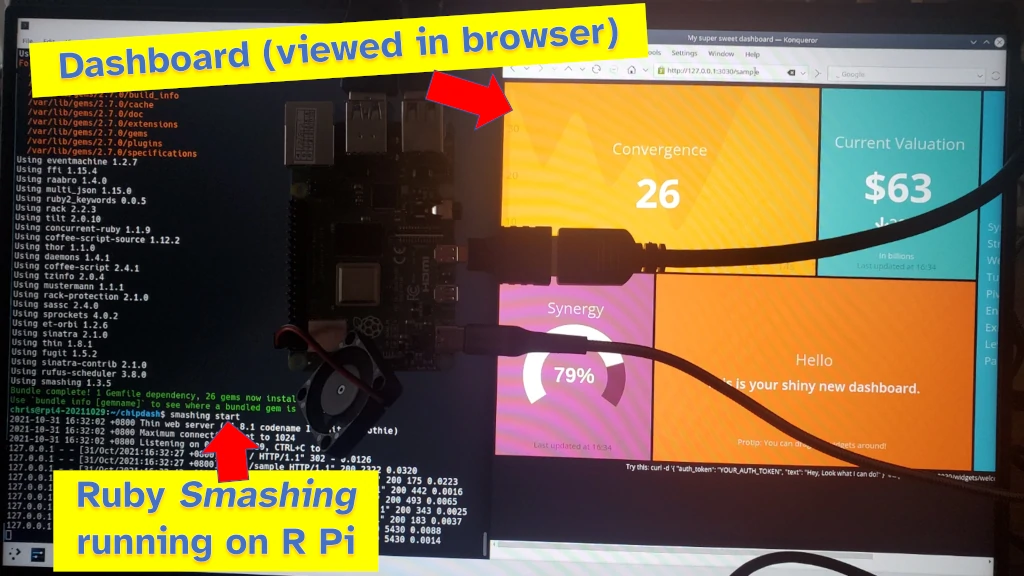
Ruby has the best data dashboard I’ve seen on Raspberry Pi. It was easy to setup and it looked great (I wrote a whole guide to Raspberry PI dashboards here: chipwired.com/raspberry-pi-dashboards/
Ruby is a general-purpose programming language that has strong data analysis and visualisation libraries (Ruby libraries are called gems). Using Ruby with Raspberry Pi can be good for:
- Displaying dashboards of data
- Basic analysis of data
- Developing interfaces to interact with data (e.g. a website hosted on the Raspberry Pi)
I found Ruby to be a very easy option to setup a dashboard on a Raspberry Pi. Out of the half-dozen dashboard tools I tried, Ruby was by far the easiest to install and setup.
To install Ruby on Raspberry Pi, open the Terminal and enter this command: sudo apt update && sudo apt install ruby-full
Ruby can then be run using the ruby command in the Terminal.
To setup a dashboard similar to my photo above, check out the Smashing package. Details can be found here on how to install and get started.
7. Cloud Services
Cloud providers offer services that a Raspberry Pi can use to analyse, store, and display data. In my guide on how to store data with Raspberry Pi (found here), I highlighted how the Raspberry Pi can store data in the cloud. A Raspberry Pi can also interact with these cloud providers to analyse the data.
Using the cloud to analyse data from a Raspberry Pi can be good for:
- Large processing tasks that would take too long using the Raspberry Pi CPU
- Processing a lot of data, if you have more data than the Raspberry Pi can store
- Backing-up data and allowing it to be used from other devices
Popular cloud data analytics providers include Azure Azure by Microsoft, Amazon AWS, and Google Cloud. I’ve found these difficult to use in a cost effective way (I mentioned Pantry Cloud and JSON Bin as free alternatives, though these only allow data storage rather than analysis). With the big names, it feels like costs can quickly escalate to the hundreds of dollars if you’re not sure what you’re doing.
Some examples of easier to use data analytics services for Raspberry Pi include:
- Zoho Analytics (which starts from $24 per month)
- Qlik Sense (who offer a fixed $30 per month plan)
A Raspberry Pi has to interface with these cloud services using their API. Details of how to work with each service’s API are available on their website. Typically this requires use of another programming language listed in this guide (such as Python, though JavaScript is also popular).
8. OCaml
OCaml is a programming language designed to help you easily express complicated mathematical operations while helping to protect you from making mistakes in your code. Because of this ability to assist in catching mistakes, it’s often used in banking and high performance computing tasks. OCaml runs on Raspberry Pi.
The best reason to install OCaml on Raspberry Pi is to learn OCaml. I’ve seen OCaml’s best uses in banking, or in processing petabytes of data – both uses which are typically out of reach of the Raspberry Pi. Therefore I can really only recommend installing OCaml on a Raspberry Pi if you want to use it to learn OCaml.
To install OCaml on Raspberry Pi, open the Terminal and type in the following command: sudo apt update && sudo apt install ocaml
To open up the OCaml interpreter after installation, run this command in the Terminal: ocaml
I found a great step-by-step guide on getting started with OCaml available here.
Chris is an electronics and electrical engineer who enjoys telling stories with pictures and data. He aims to help more people unlock the power of data, and getting hands on with it (such as by using a Raspberry Pi) is one of his approaches.