Raspberry Pi is an excellent data manipulation tool thanks to its abilities to collect, store, analyse, and display data. This guide is all about how a Raspberry Pi can be used to display data using dashboards.
A Raspberry Pi can display a data dashboard by coding an app to run on the Raspberry Pi, or by connecting the Raspberry Pi to an external dashboard tool such as Tableau. Coding a dashboard on a Raspberry Pi can be done in programming languages such as Ruby, Python, R, and Julia. A web browser running on the Raspberry Pi can then be used to view these dashboards.
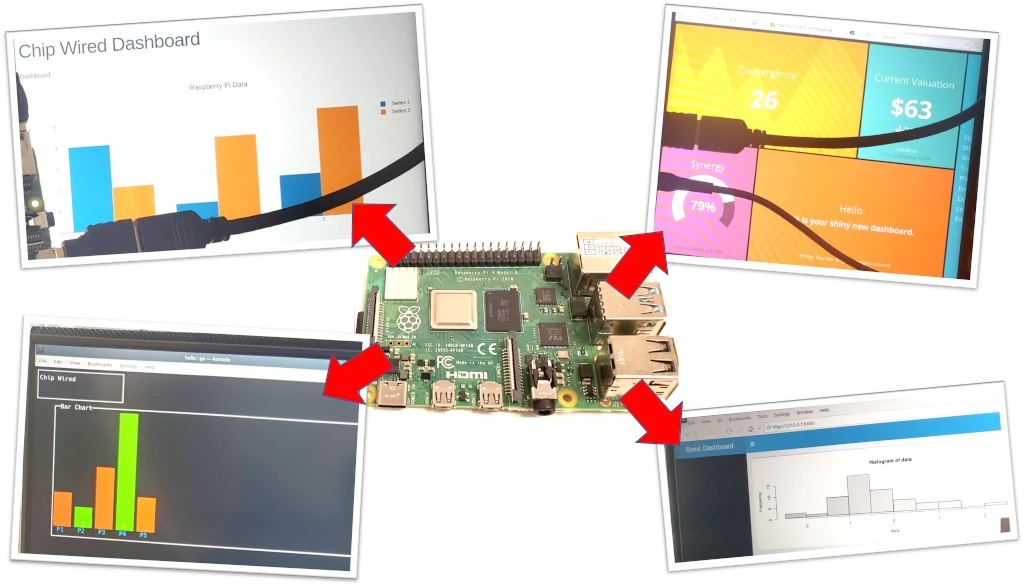
Nearly all of the example dashboards in this guide use a web browser (Chromium, Firefox etc.) to actually view the dashboard. The tools here will help you build a dashboard server that you can then visit from a browser running on your Raspberry Pi or from another device on the same network.
If you you want to show PowerPoint on your Raspberry Pi, I wrote a separate guide to that here: chipwired.com/display-powerpoint-raspberry-pi
Ruby and Smashing dashboard
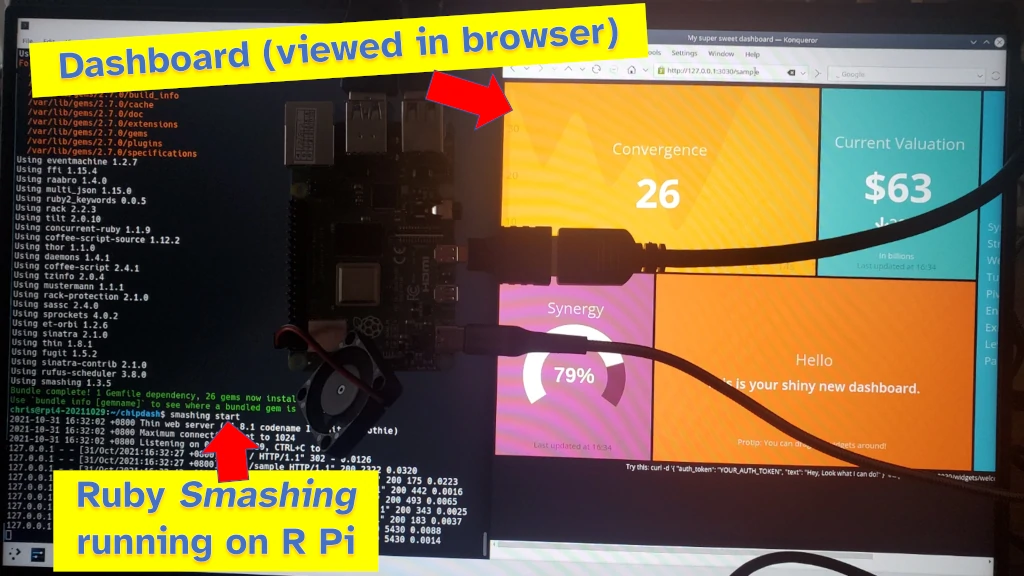
Ruby is an easy to use programming language that runs on Raspberry Pi. It can be used to build a dashboard on the Raspberry Pi using its Smashing dashboard library (Ruby libraries are also called gems).
A web browser can connect to the Ruby app running on the Raspberry Pi to display the data. The Raspberry Pi’s own web browser can also connect to the dashboard app (this is what I did to get the photo below).
Using Ruby to build a dashboard on a Raspberry Pi is great for:
- Publicly displaying data on a big screen connected to the Raspberry Pi
- Quickly building an attractive looking dashboard
- Displaying data on another device (e.g. a phone)
Interested in the screen I’m using to display these dashboards? I use a portable 15.6″ HD monitor like this one (cost me around $160 when I bought it – and note you must use HDMI as the USB-C won’t work with Rasbperry Pi) to display my Raspberry Pi. It’s a bit power hungry so consider a smaller display like this if you’re concerned about how much power it uses.
I feel Smashing is the best dashboard tool on this list. It was easy to install, and looks great out-of-the-box.
To setup a Smashing dashboard on Raspberry Pi:
- Install Ruby by opening a terminal and typing:
sudo apt update && sudo apt install ruby-full - Follow the instructions here to install and run Smashing
And that’s it! I found it to be the easiest dashboard to setup and use out of any of the dashboards I’ve compared on this list.
It did take me a long time though to install Smashing which I thought was odd. I thought Julia was the slowest language for importing libraries, but the amount of time it took to install Smashing changed my mind. I didn’t time it, though it must’ve taken more than 10 minutes just to install Smashing (even though Ruby was installed in under a minute).
The next step is to display some data on the dashboard. This involves collecting data and analysing data. If you want to find out the various ways a Raspberry Pi can collect data, check out my guide here: chipwired.com/collect-data-with-raspberry-pi/
The R library shinydashboard
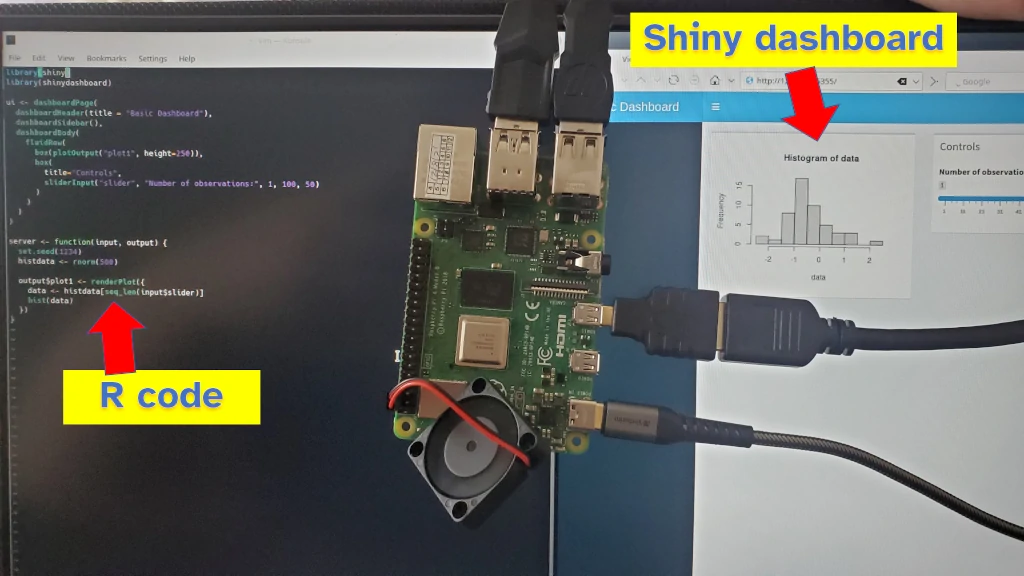
The R programming language works on Raspberry Pi; that means the shinydashboard library for R also works on Raspberry Pi.
Shinydashboard is built to use the R package shiny to create self-hosted dashboards based on data that has been collected and analysed using R apps and scripts. R is a great programming language for data manipulation, and shiny and shinydashboard give you the tools to display that data as a website (hosted from a Raspberry Pi)
For a Raspberry Pi, I’ve found shinydashboard and R to be great for:
- Using a screen attached to the Raspberry Pi to show plots
- If you want to manipulate the dashboard using inputs displayed on the dashboard (e.g. zoom or filter)
- Displaying the dashboard on another device connected to the same LAN/WiFi (e.g. viewing the dashboard on a mobile phone which is connected to the same WiFi as the Raspberry Pi)
I found though that Ruby offered a more attractive dashboard (see below for Ruby where I’ve included a photo of its easy-to-use dashboard package).
To setup an R dashboard on your Raspberry Pi:
- Install R by opening the Terminal and enter in:
sudo apt update && sudo apt install r-base r-base-dev - Once R is installed, open the interpreter by typing this command:
r - Follow the steps here to install the shinydashboard package and setup a basic dashboard
Golang’s termui library
Go (or Golang) is another programming language that works on Raspberry Pi. Someone wrote a library for Go that displays a dashboard in the terminal.
A Raspberry Pi can display a dashboard in its Terminal window using Go and the termui library.
This can be useful for:
- Understanding data that is changing quickly, straight from the terminal
- Having a cool display (see below) that you can show on a screen attached to the Raspberry Pi
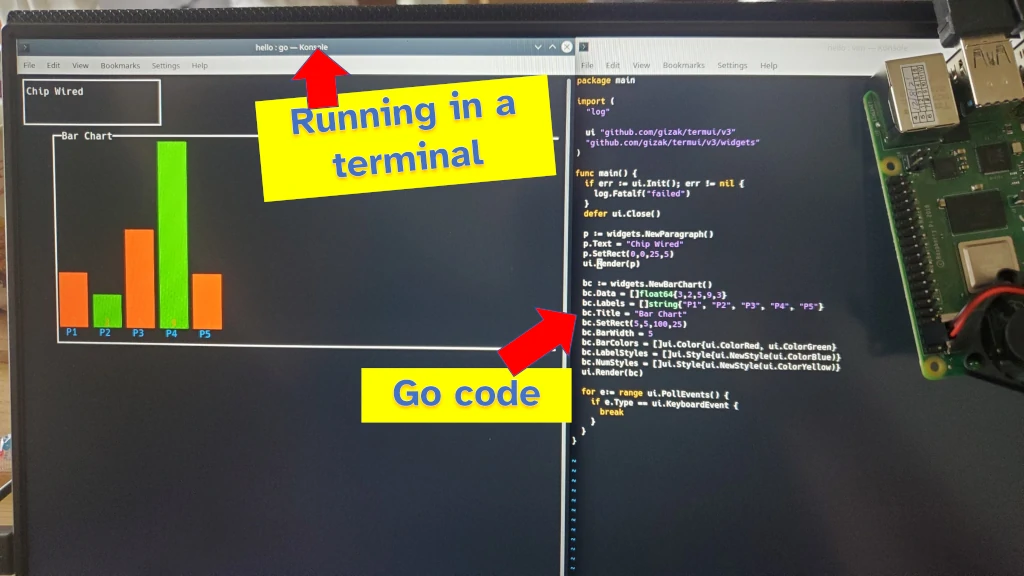
I like the look of this dashboard; it makes the Raspberry Pi feel more like a machine. Apart from being able inspect live data from the Raspberry Pi, the only other use I could think of for this is to put on a screen and show off the Raspberry Pi.
To build a Terminal dashboard with Go:
- Download Go from here. Select the arm64 if using Ubuntu or Debian (or any 64bit OS), or the armv6l if using Raspberry Pi OS
- Follow the installation instructions here
- Install termui using the instructions here (I found I still did have to use the command
go getas my installation of Go did not download the library automatically)
Go isn’t the easiest language to install on a computer. In terms of what could go wrong (no pun intended), I reckon it’s the hardest dashboard to setup on this list. I really still do like the look though.
Want to monitor your Raspberry Pi with a cool dashboard? Check out some ideas I put together in a guide here: chipwired.com/monitor-raspberry-pi
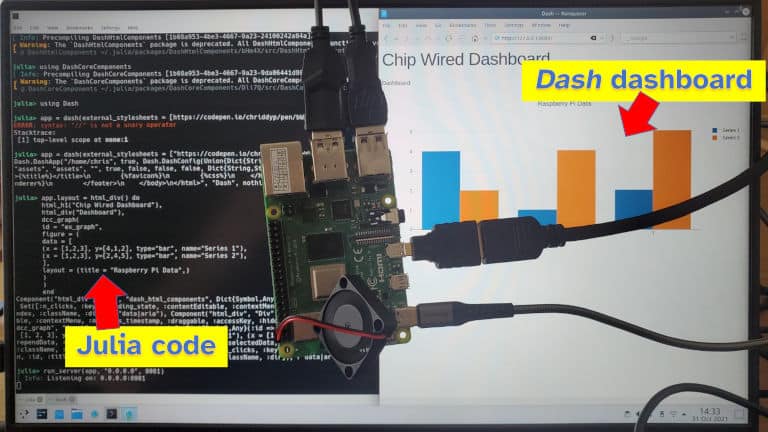
The dash package in Julia
Julia is another data-focused programming language that runs on Raspberry Pi. A lot of Python packages work well on Julia, including dash, a package for writing dashboards.
A Raspberry Pi can host and display a dashboard using the dash package running from Julia.
Running Julia on a Raspberry Pi can be great for:
- Applying complex mathematical transformations to data – Julia is great at easily applying mathematical operations in code
- Using AI or machine learning on data
- Displaying the results of the above on a dashboard
Dashboards in Julia are typically accessible from the Raspberry Pi itself (by using a browser to communicate with the Julia app) or by another device on the same network.
To setup a dashboard using Julia on Raspberry Pi:
- Install Julia by opening the terminal and typing this command:
sudo apt update && sudo apt install julia-common - Open the Julia REPL by typing this command:
julia - Press the
]key (yes that’s right, the ‘close square bracket’ key) to enter package mode - Type this command to install dash and its packages:
add Dash DashCoreComponents DashHtmlComponents DashTable - Press CTRL+C to exit package mode
- Follow the usage instructions here to setup a simple dashboard
I didn’t find it too hard to setup dash in Julia, despite there being more steps. It can take a while though to execute a using command for the first time – I think this is because Julia compiles the library when you use this command. You can type commands straight into the REPL prompt, or you can type them into a .jl script then execute that script using the julia command.
Python and dash
The dash package is also available for Python, with Python offering an alternative way to run the dash package on a Raspberry Pi. Python running on a Raspberry Pi can display a data dashboard using the dash package.
Using Python to build a dashboard on a Raspberry Pi can be good if:
- You’re new to coding (Python has a generous community if you need to search for answers to a problem)
- Analysing your data relies on a Python-specific tool
- You’re not confident installing additional tools on your Raspberry Pi (if you’ve followed the default setup then you likely have Python installed already)
I’ve found Python to be a quick way to get a dashboard up-and-running on a Raspberry Pi.
For a complete guide on how to setup a dashboard with Python, check out this one here. It seems to cover all the steps necessary (once Python is installed) to code a dashboard.
Javascript and Node
Javascript can be used on a Raspberry Pi by installing Node or through the use of a web browser such as Chromium or Firefox. It is possible to build a dashboard in Javascript and have it run on a Raspberry Pi, however it is not as straightforward as the other options in this guide.
Using Javascript to build a dashboard is a good idea when you:
- Know Javascript already
- Want complete control over how your dashboard will look and behave
- Want to have interactive elements on your dashboard
I couldn’t find any quick and simple dashboard-ing libraries for node. This means you would have to code the entire dashboard (data source, appearance, layout etc.) from scratch – Javascript, HTML, and CSS.
To run a dashboard using JavaScript on Raspberry Pi:
- Install Node (or use the browser-based links if available)
- If using Node, install a server such as Express
- Pick a dashboard library and use it
Tableau
Data from a Raspberry Pi can be connected to Tableau to use in a Tableau dashboard.
A Raspberry Pi can be setup to connect to Tableau using any of the following:
- R
- Python
- Matlab
- Tableau API
Once connected, the Raspberry Pi can share its data and Tableau can be used to display it as a dashboard.
The Raspberry Pi should access Tableau using a web browser such as Chromium or Firefox.
Chris has a background in computer science, data, and electronics. He’s busy exploring the overlap of these, and a Raspberry Pi dashboard is the perfect example.