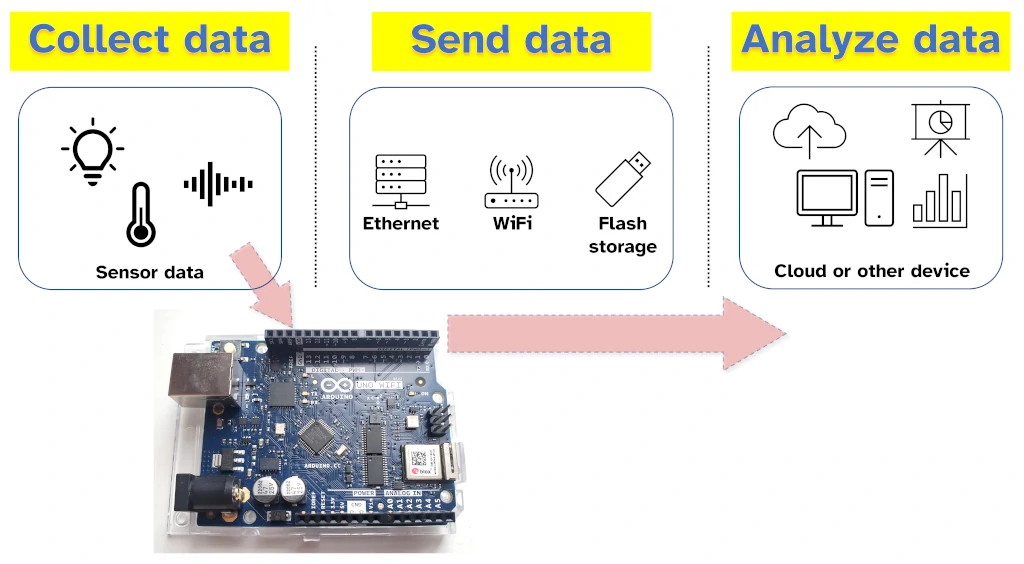
Arduino is a great tool for collecting data. This data can be analyzed to make decisions, meaning an Arduino can be a key part of a data-based decision making process. An Arduino can collect data from sensors, store it, and send it to another device for further analysis. I wrote this guide to help people understand how an Arduino can be used as part of a data analysis process.
To analyze data with an Arduino:
- Decide what to measure and connect sensors to the Arduino to measure it
- Read data from these sensors
- Send the data to another device for analysis
- Analyze the data and make decisions
This guide covers deciding which data to collect, connecting sensors to the Arduino, reading the data, and then transmitting it to another device for analysis. I work extensively with data and it’s exciting to see how an Arduino can be used as part of a strong data analysis process.
Step 1: Decide the data to collect and find sensors to measure it
Data analysis typically starts with figuring out what decisions we want to make: Do we want our autonomous car to accelerate or brake; should we bring an umbrella; do I need to add more water to this soil; etc. To decide which data to collect, and how to collect it, we need to understand the objective of our project.
What decision is our Arduino going to help us make? Understanding the decision we want to make helps us figure out which sensors we need to use to collect data.
| Decision | Sensor |
|---|---|
| Should we bring an umbrella? | Temperature, humidity |
| Do I need to add more water to my plant? | Soil moisture |
| Should we turn this tap on? | Water flow sensor |
| How busy is this road? | Count cars using laser sensor |
| is someone behind me? | Motion sensor |
Sensors that I’ve found work well with Arduino include:
- Color
- Soil moisture
- Temperature and humidity
- Magnetic field, electricity, voltage
- Motion (tilt, acceleration)
- Fire
- Light
- Sound
If you need more ideas for sensors, check out my huge guide to over 20 sensors that work with Arduino here: chipwired.com/arduino-sensors-uses-costs-connections/
These sensors typically connect to an Arduino using the analog pins, digital pins, SPI, or I2C. Each sensor will come with a datasheet (check out the store where you bought it, most include the PDF on the product page). This datasheet will tell you how the sensor reports data – typically analog (so connect to the analog pin) or SPI/I2C (connect to these pins on your Arduino).
To connect a sensor to an Arduino:
- Identify how the sensor wants to be connected to the Arduino (typically the SPI or I2C connection, but it may also be an analog pin or a regular digital pin)
- Connect the sensor to the correct pins or headers
- Read the sensor using a sketch (see Step 2 below)
It’s possible to connect multiple sensors to an Arduino. An I2C connection can typically support up to a dozen sensors (theoretically 127 can be connected, but in practice it’s much less, check out this explanation if you want to know why). Personally I’ve never had a problem connecting 3-4 sensors to the same Arduino.
Step 2: Read and collect the data
The next step, after connecting sensors to the Arduino, is to collect the data.
I’ve seen typically two ways to read sensors in a sketch: Directly from an analog pin, or by reading serial data from SPI or I2C. There are other ways (e.g. digital pins), but these are the most common ways I’ve seen.
(photo of pin out from Arduino)
To read from the analog pin, check out the sample sketch below:
#include <EEPROM.h>

int reading = 0;
int storageAddress = 0;

void setup() {
  pinMode(A0, INPUT);
}

void loop() {
  reading = analogRead(A0);
  EEPROM.put(storageAddress, reading);
  storageAddress += sizeof(int);
  delay(500);
}
This code takes a reading from the analog pin (where the sensor is connected) and then saves it to the EEPROM. For most data analysis projects, you’ll probably want to transmit the reading via WiFi or Ethernet, or store it to an SD card for collection later (see Step 3 below) – I made this example short so it fit in this guide.
To read a sensor using the Arduino’s SPI connection:
- Include the SPI.h library
- Call SPI.begin() in the setup() function
- Communicate with the SPI device in the loop() function
I found SPI a little trickier to setup than reading from the analog pin. Check out this example for more detail on writing a sketch that uses SPI. The Arduino library reference is here.
To read a sensor using the Arduino’s I2C connection:
- Include the Wire.h library
- Call Wire.begin() in the setup() function
- In the loop() function:
- Call Wire.beginTransmission(address) to transmit to device with address
- Call Wire.write(byte) to send it data
- Call Wire.endTransmission() to stop transmitting data to the device
While I2C seems harder to use, I found the logic flow of an I2C sketch to be clearer than SPI. Check out this example for how I2C is used in practice, and the Arduino reference for I2C can be found here.
After collecting the data, the next step is to send it somewhere for analysis.
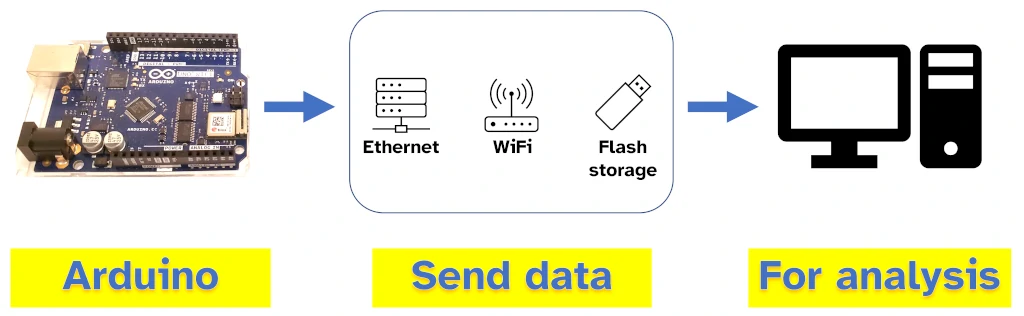
Step 3: Send the data for analysis
An Arduino used in a data analysis process typically sends its data to another device for analysis. This device is typically a desktop or laptop computer, a Raspberry Pi, or the cloud.
Arduino boards in general are capable of sending data in the following ways:
- Ethernet or WiFi
- Bluetooth
- USB mass storage device
- Serial connection
- SD card
Some of these methods may not be available on all Arduino (e.g. UNO Rev 3 doesn’t have Bluetooth built in), and some can be added by shields (e.g. a Bluetooth shield or an SD card shield). I’ve found the easiest ways to send data from an Arduino for data analysis are by using WiFi or an SD card.
If you want to know more about which communication methods are supported by which Arduino, this is one of the points I covered in my guide on the best Arduino for people starting out, check it out here: chipwired.com/best-arduino-for-beginners/
Sending sensor data from an Arduino generally involves:
- Save the data from the sensor in the Arduino’s memory (see Step 2 above)
- Open a connection to another device (e.g. WiFi), or open a file on an SD card
- Write the data to the connection or to the file
For detail on how to use an SD card, check out this example of a data logger on the Arduino website. The reference for the SD card library can be found here.
For detail on how to use a WiFi connection, check out my WiFi guide here: chipwired.com/arduino-board-wifi-guide/ (scroll down to the How to use section)
While an Arduino can do basic analysis tasks (such as filtering out erroneous readings), I prefer to leave all analysis to a more powerful computer. My engineer’s brain always has me looking for the best tools for the job: An Arduino is great at reading data from sensors, a more powerful computer is great at analysing data.
Step 4: Analyze and visualize the data
Once the data is sent to another device, it can be analysed and displayed for decision making.
Typical data analysis tasks that are applied to data collected by Arduino include:
- Filtering of data – do we want to see data over a certain time period; do we want to remove outliers?
- Categorisation – Grouping the data into categories (though typically with an Arduino analytics process, we took care of this in Step 1 when we decided which sensors we were going to use);
- Correlation – comparing 2-3 categories of data, including comparing over time, to see if there is any relationship between them.
The easiest way I’ve found to analyse this data is to use Excel. to use Excel with data collected by an Arduino, first save that data as a CSV file, then open the file in Excel and convert it to Excel’s format.
Alternative (and cheaper) ways to analyse data include:
- Python, using the Pandas library
- Ruby
- Directly in visualisation tools such as Tableau or Power BI
Arduino also offers its Cloud IoT service which is free to begin with and then $2/month if you want to work with a few different devices. Details of Arduino Cloud IoT can be found here.
Visualising data uses similar tools. The best ways to visualise data that has come from an Arduino include:
- Drawing graphs in Python or Ruby on a computer
- Using Excel
- Connecting to the Arduino Cloud
- Building a dashboard on another device (e.g. Raspberry Pi)
- Connecting to another third party service such as Tableau
Want to setup a data dashboard using Raspberry Pi? I wrote a guide on how to get started displaying data with Raspberry Pi here: chipwired.com/raspberry-pi-dashboards/
I’ve found the Arduino to be a great tool as part of a data analysis process. It’s great at collecting data and sending that data to another tool for processing. Arduino does this in a very efficient way, efficient in terms of the time you spend setting it up, the costs involved, and even the amount of power it uses (not much!). If you’re interested in reading more about Arduino, check out all the great guides we have here: chipwired.com/category/arduino/
Chris enjoys working with data, software, and electronics. Analysing data with Arduino is the perfect overlap of these interests. Chris shares his knowledge here hoping you’ll get excited about the potential of uses of these areas as well.